Indicator Description
The Comprehensive Market Analyzer is a versatile tool designed for traders who need a comprehensive view of the market using a variety of technical indicators. This indicator integrates several advanced techniques to provide a detailed analysis that helps traders make informed decisions.
The indicator dynamically adjusts to market conditions, allowing traders to analyze trends, identify key levels, and spot potential reversal points. It includes customizable settings for each indicator, enabling precise fine-tuning based on the specific market instrument.
Signals are generated by combining multiple indicators, enhancing the reliability and accuracy of each alert. This approach ensures that traders receive actionable insights, helping them navigate various market scenarios with confidence. Additionally, the advanced dashboard visually summarizes critical data, facilitating quick interpretation and response.
Comprehensive Market Analyzer in action on a selected financial instrument.
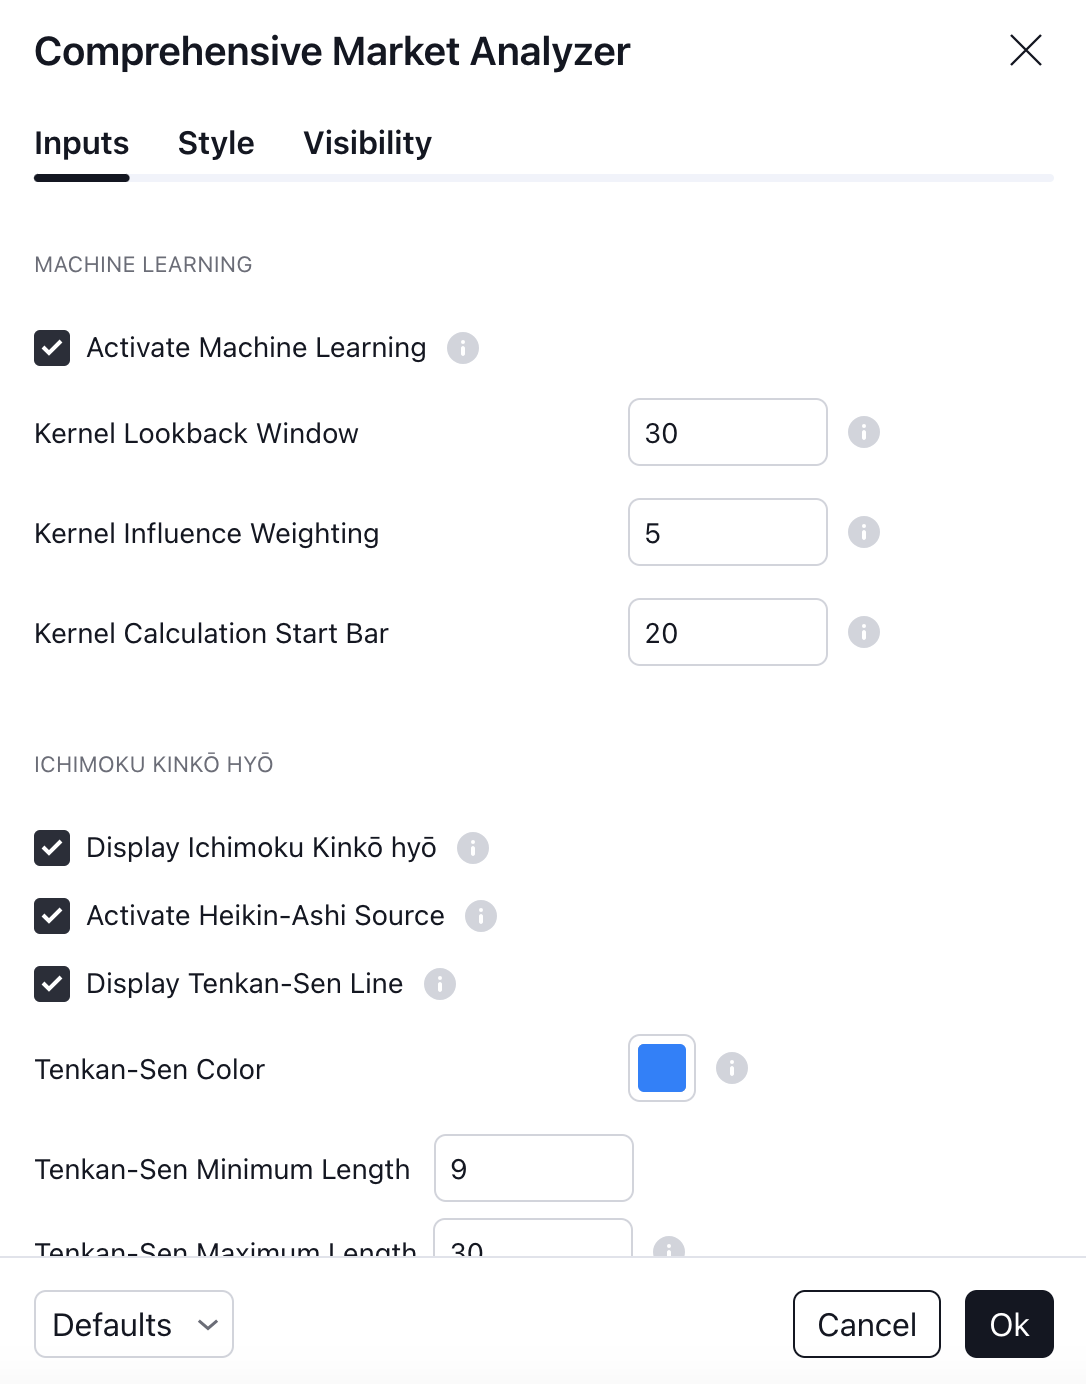
Complete list of features included in this indicator:
- Machine Learning: Utilizes advanced algorithms to analyze historical data and predict trends, with customizable analysis settings for refined signals.
- Ichimoku Kinkō Hyō: Provides a full set of Ichimoku components, adjustable for volatility, with color-coded signals for quick trend assessment.
- Candlestick Patterns: Detects bullish and bearish patterns, including advanced formations, with customizable color labels and trend filters.
- Fibonacci Retracement Levels: Plots retracement levels with user-defined inputs and up to 18 customizable levels for in-depth support/resistance analysis.
- Support & Resistance: Identifies key support/resistance levels, integrates Bollinger Bands, and provides breakout alerts for strategic entry/exit points.
- Trend Lines: Plots trend lines based on market structure, highlights key pivots, and sets alerts for potential turning points.
- Linear Regression Projection: Displays a projection line to forecast price movements, with customizable visualization and alerts for crossovers.
- Point of Control (POC) Analysis: Highlights the POC level for maximum trading volume and changes color based on price position relative to the POC.
- Divergence Analysis: Detects bullish and bearish divergences for potential trend reversals, with color-coded lines and alerts for easy monitoring.
- Average True Range (ATR) Analysis: Uses ATR for identifying volatility-based trading signals, with configurable periods and customizable color labels.
- ATR Strength Visualization: Shows a volatility bar based on ATR with adjustable thresholds and color-coded labels for strategic analysis.
- RSI Meter Visualization: Displays an interactive RSI meter with color-coded sections and a dynamic needle for visual momentum analysis.
- Market Sentiment Analysis: Combines indicators like IV, PCR, and MACD to gauge market sentiment, with dynamic thresholds and visual indicators.
- Market Trend Dashboard: Offers a comprehensive overview of key market indicators, including Ichimoku, MACD, RSI, and more, with color-coded alerts for trend identification.

All options come with default settings that can be customized based on the specific market instrument you are analyzing. You can also configure alerts to be notified whenever a new signal is generated by the indicator. These alerts are condition-based, allowing you to selectively enable or disable specific alerts according to your trading strategy.